The goal of today’s lab is to practice two-sample statistical inference using both simulation- and CLT-based approaches.
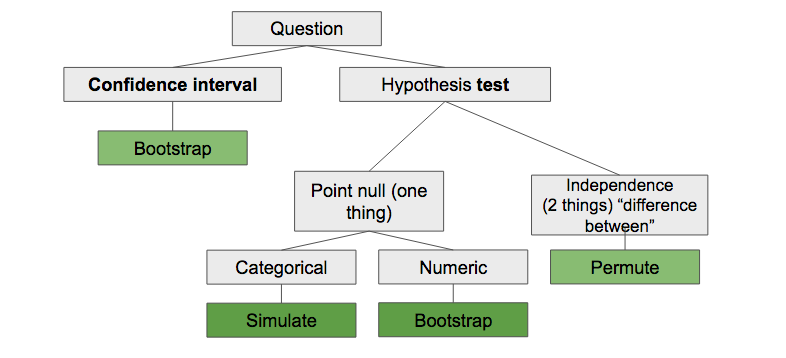
Use the lecture notes, readings, and application exercises to help you complete the lab. You can also use this chart on simulation-based inference to help you determine the appropriate sampling scheme when conducting simulation-based inference.
Today’s dataset has been adapted from Scott Cole’s Burritos of San Diego project, located here. The goal of the project was to identify the best and worst burritos in San Diego, characterize variance in burrito quality, and generate predictive models for what makes a burrito great.
As part of this project, 71 participants reviewed burritos from 79 different taco shops. Reviewers captured objective measures of the burrito (such as whether it contains certain ingredients) and reviewed it on a number of metrics (such as quality of the tortilla, the temperature, quality of meat, etc.). For the purposes of this lab, you may consider each of these observations to be an independent, representative sample of all burritos.
The subjective ratings in the dataset are as follows. Each variable is ranked on a 0 to 5 point scale, with 0 being the worst and 5 being the best.
tortilla: quality of the tortillatemp: temperature of the burritomeat: quality of the meatfillings: quality of non-meat fillingssalsa: quality of the salsamfr: meat-to-filling ratiouniformity: whether each bite contains a uniform slew of ingredients (e.g., a bite entirely composed of tortilla and sour cream would probably be terrible)synergy: how well it all comes togetherIn addition, the reviewers noted the presence of the following burrito components. Each of the following variables is a binary variable taking on values present or none:
guac: guacamolecheese: cheesefries: fries (it’s a thing, look it up.)sourcream: sour creamrice: ricebeans: beansThe data for today’s lab may be found by cloning your repository available at the class GitHub repository. Load the data into your RStudio environment, and don’t forget to configure GitHub beforehand.
To following resource provides code needed to make useful symbols. You may use the code to typeset the characters of interest in the narrative of your document:
$\mu$$\alpha$$\ge$$\le$$\neq$$H_0$$H_a$At the start of each exercise that requires simulation, set a random seed equal to the exercise number in the R chunk.
alrightsolidwhoa!Knit to PDF to create a PDF document. Knit and commit all remaining changes, and push your work to GitHub. Make sure all files are updated on your GitHub repo.
Please only upload your PDF document to Gradescope. Associate the “Overall” graded section with the first page of your PDF, and mark where each answer is to the exercises. If any answer spans multiple pages, then mark all pages.